Semantic Object Accuracy for Generative Text-to-Image Synthesis
Tobias Hinz
30 October 2019
Reading time: 8 minutes
This blog post summarizes the highlights of our paper Semantic Object Accuracy for Generative Text-to-Image Synthesis. In this paper we introduce both a new model for adversarial text-to-image (TTI) synthesis and a novel evaluation metric for text-to-image synthesis models. While our model is a variant of a Generative Adversarial Network (GAN), the evaluation metric can, in principle, be applied to any generative model that generates images from textual image descriptions.
Semantic Object Accuracy (SOA)
Our evaluation metric, which we call Semantic Object Accuracy (SOA), tries to address some problems that current popular evaluation metrics for TTI tasks suffer from. In the following, we will quickly highlight these problems and then describe how the SOA tries to address them.
The two most common evaluation metrics for adversarial TTI models, the Inception Score (IS) and the Fréchet Inception Distance (FID), rely on a CNN that is pre-trained to classify images from the ImageNet dataset. This network is used on a large number of generated images (e.g. 30,000 generated images) and the network’s activations from different layers are used to calculate the scores.
The IS tries to measure two things: whether generated images contain a clearly recognizable object and whether the model can generate images of many different object categories. To calculate the IS we use the model’s classification output, i.e. the Softmax layer. For each of the generated images the entropy in the Softmax layer should be small (i.e. the network should be confident that there is one specific object in the image), while the overall entropy over the classification outputs for all images should be large (i.e. the generated images should contain objects of many different classes). The FID, on the other hand, uses the activations from an intermediate layer (e.g. the last convolutional layer) and compares the activations on this layer for generated images to the activation for real images. If the difference between activations for generated and real images is small, this should indicate that the generated images are of similar quality as the real images.
There are two main drawbacks to the IS and the FID when it comes to evaluating TTI models. The first one applies to all TTI models in that neither the IS nor the FID actually take the image caption into account when evaluating the generated image. Thus, the generated image could be judged as “good quality” even though it depicts something completely different from the image caption. The second problem is that, for more complex datasets such as the MS-COCO dataset, both of them rely on the CNN pre-trained on the ImageNet dataset. However, the ImageNet dataset is quite different from the dataset we are working on (MS-COCO), in that the ImageNet dataset consists of images that usually contain one specific object at the image center, whereas the MS-COCO dataset consists of images that contain many different objects at various locations throughout an image.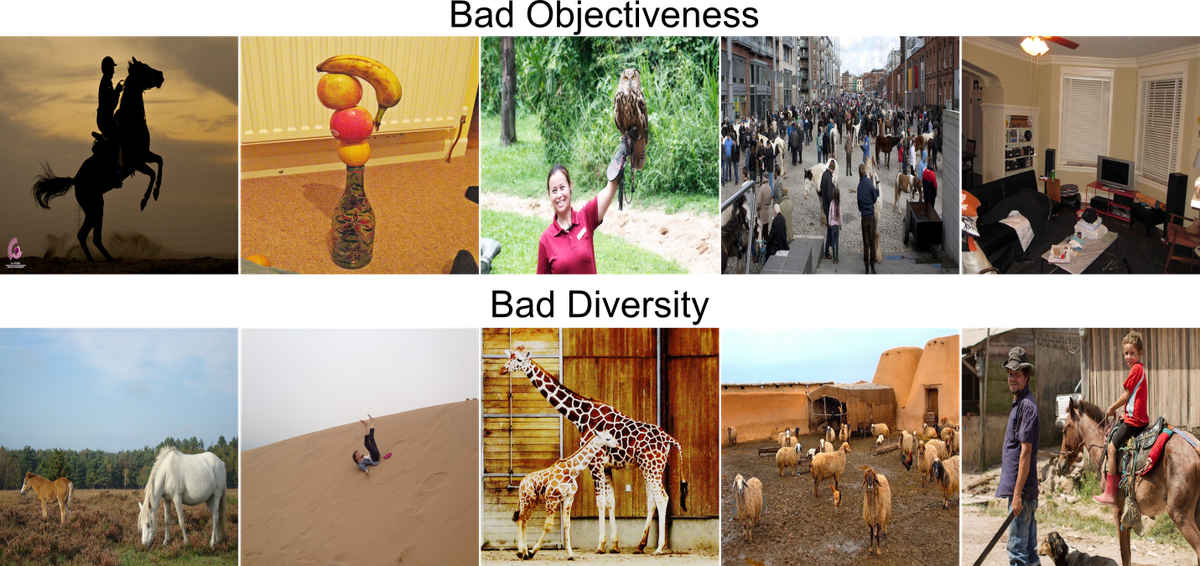
R-precision, introduced in the AttnGAN paper, is a score that tries to address these problems by first pretraining a CNN and a text encoder so that embeddings of real images are similar to the embeddings of their corresponding image captions. To evaluate a generative model we then use one of the captions to generate an image from it. We then sample another 99 captions randomly from the dataset and calculate the similarity between the embedding of the generated image and the embeddings of the 100 captions (one correct, 99 wrong). If the generated image’s embedding is most similar to the correct caption this is counted as a success and the R-precision score represents how often this is the case.
Intuitively, the R-precision calculates if the real caption is more similar to the generated image (in feature space) than 99 randomly sampled captions. However, the drawback is that this metric does not necessarily evaluate the quality of individual (foreground) objects. For example the real caption could state that there is a person standing on a snowy hill} while the 99 random captions do not mention “snow’’ (which usually covers most of the background in the generated image) or “person’’ (but e.g. giraffe, car, bedroom, etc). In this case, an image with only white background (snow) would already make the real caption rank very highly in the metric and if there is a shape roughly resembling a person somewhere in the image the real caption would most likely be ranked at the top. Furthermore, many adversarial TTI models already use the image and caption encoder during training and are, therefore, likely to overfit to this measure.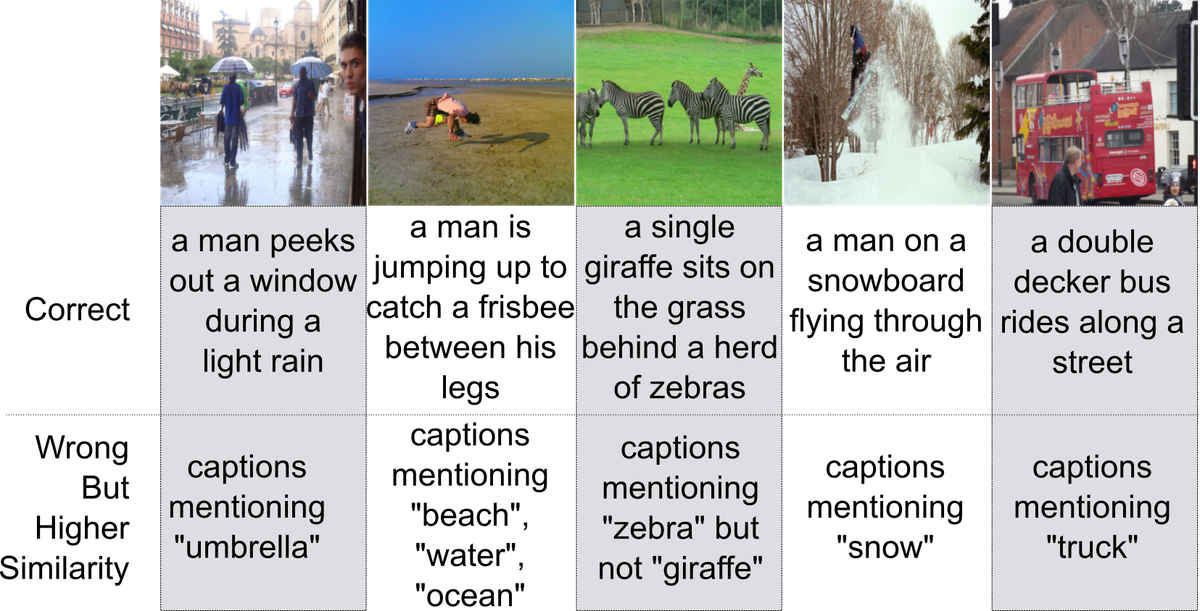
Actually, when we calculate the IS, FID, and R-precision on the original images we find that for the IS and the R-precision many models already achieve scores similar to the scores obtained on real images. This is despite the fact that, so far, no model is capable of consistently generating images that are even close to being judged as “real” by humans. Only for the FID the score is still much better for the original images when compared to generated images.
We discuss the advantages and disadvantages of several other evaluation approaches in our paper but will now talk about how the SOA tries to address the above mentioned challenges. As we have seen, the main problems are that 1) images are evaluated without taking the image caption into consideration (IS, FID), 2) images are evaluated with a CNN pre-trained on an unsuitable dataset (IS, FID), 3) images are evaluated based on background characteristics (R-precision), and 4) models might already overfit to the evaluation metric during training (R-precision).
We address all four challenges with a simple approach: we use a pre-trained object detector to evaluate whether generated images contain objects that are specifically mentioned in the image caption. For example, if we generate an image from the caption “a car is driving down the street”, we would assume that the resulting image contains a car. All we need for this is an object detector for the given dataset. Luckily, many good pre-trained object detectors are available for the MS-COCO dataset. To calculate the Semantic Object Accuracy we therefore proceed as follows:
For each of the 80 foreground objects that are specifically labeled in the MS-COCO dataset obtain all captions that specifically mention it (e.g. captions that contain “person, woman, man, …” for the label “person”, captions that contain “monitor, tv, screen, …” for the label “monitor”, etc).
Generate images for each of the obtained captions.
Use the object detector (we use a pre-trained YOLOv3 network) to evaluate if a generated image contains the object that it should contain.
For each label calculate how often the specific object was detected in the generated images for this label.
For the MS-COCO dataset this gives us 80 individual results (since the MS-COCO dataset has labels for 80 individual objects). To boil this down to an easily understandable number (because that is what the computer vision community likes) we suggest two approaches: 1) calculate the average accuracy over all classes (SOA-C) or 2) calculate the average accuracy over all images (SOA-I).
The SOA addresses all previously mentioned problems since it 1) takes the image caption into account, 2) evaluates images with an object detector pre-trained on the same domain, 3) specifically focuses on foreground objects, and 4) the model can not overfit to it during training. In our paper we calculate the SOA scores for our approach, as well as for several other state-of-the-art approaches which have pre-trained models freely available such as the AttnGAN, the Obj-GAN, and the DM-GAN.
Our Model
The model is an extension and adaptation of our ICLR paper from this year. It adds object pathways to the generator and discriminator of a Generative Adversarial Net (GAN). These object pathways are responsible for explicitly modeling individual objects within images and do improve the performance considerably compared to the baseline AttnGAN model. In contrast to the previous model we have object pathways on all discriminators, as well as on multiple layers throughout the generator. Furthermore, we update the loss function that is used to train the generator and increase the number of objects with which we train. For further details please refer to Section 3 (Approach) in our paper.
Evaluation
We evaluate both our model and several state-of-the-art approaches with available pre-trained models. Besides calculating the SOA scores for all of these models we also compare the IS, FID, and R-precision.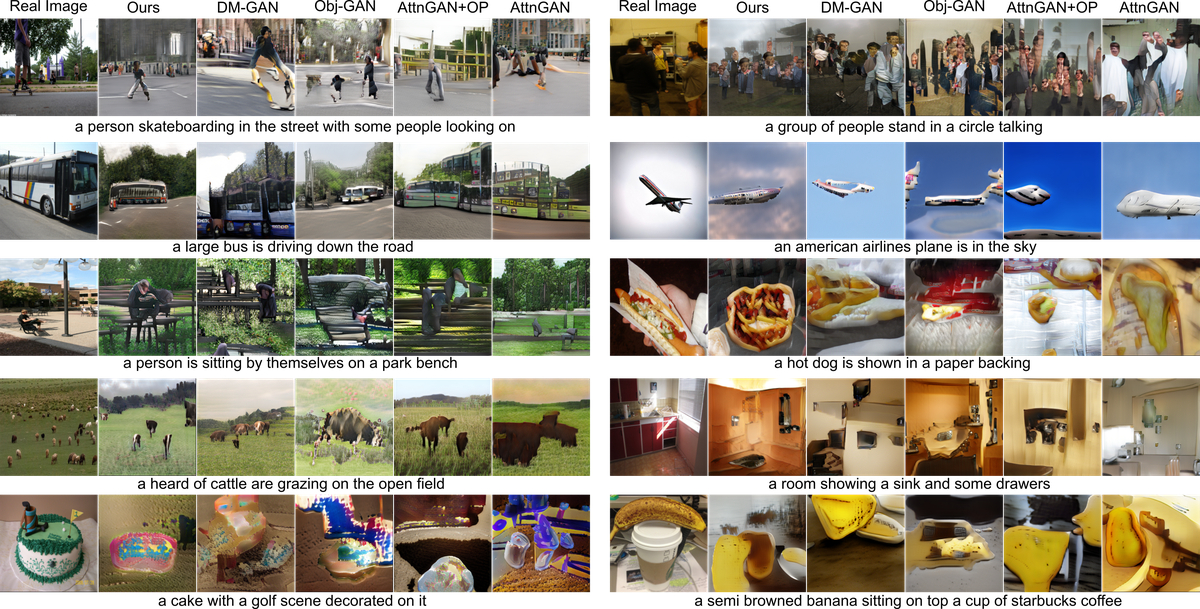
Our model achieves state-of-the-art performance on the FID score, is about tied with the DM-GAN in the SOA scores, and is competitive in the IS and R-precision. While the SOA-C (class average SOA) on real images is about 75, the best TTI models only achieve scores of around 25-35. The same is true for the SOA-I (image average SOA), where original images achieve a score of about 80, while the best models only achieve scores between 40-50.
Interestingly, when we compare the SOA scores of the different models we find that all of them perform similarly good or bad at the same objects. For example, all models perform reasonably well on objects such as person and pizza (many examples in the training set) as well as e.g. plane and traffic light (few examples in the training set). Conversely, all models fail on objects such as table and skateboard (many examples in the training set) as well as e.g. hair drier and toaster (few examples in the training set).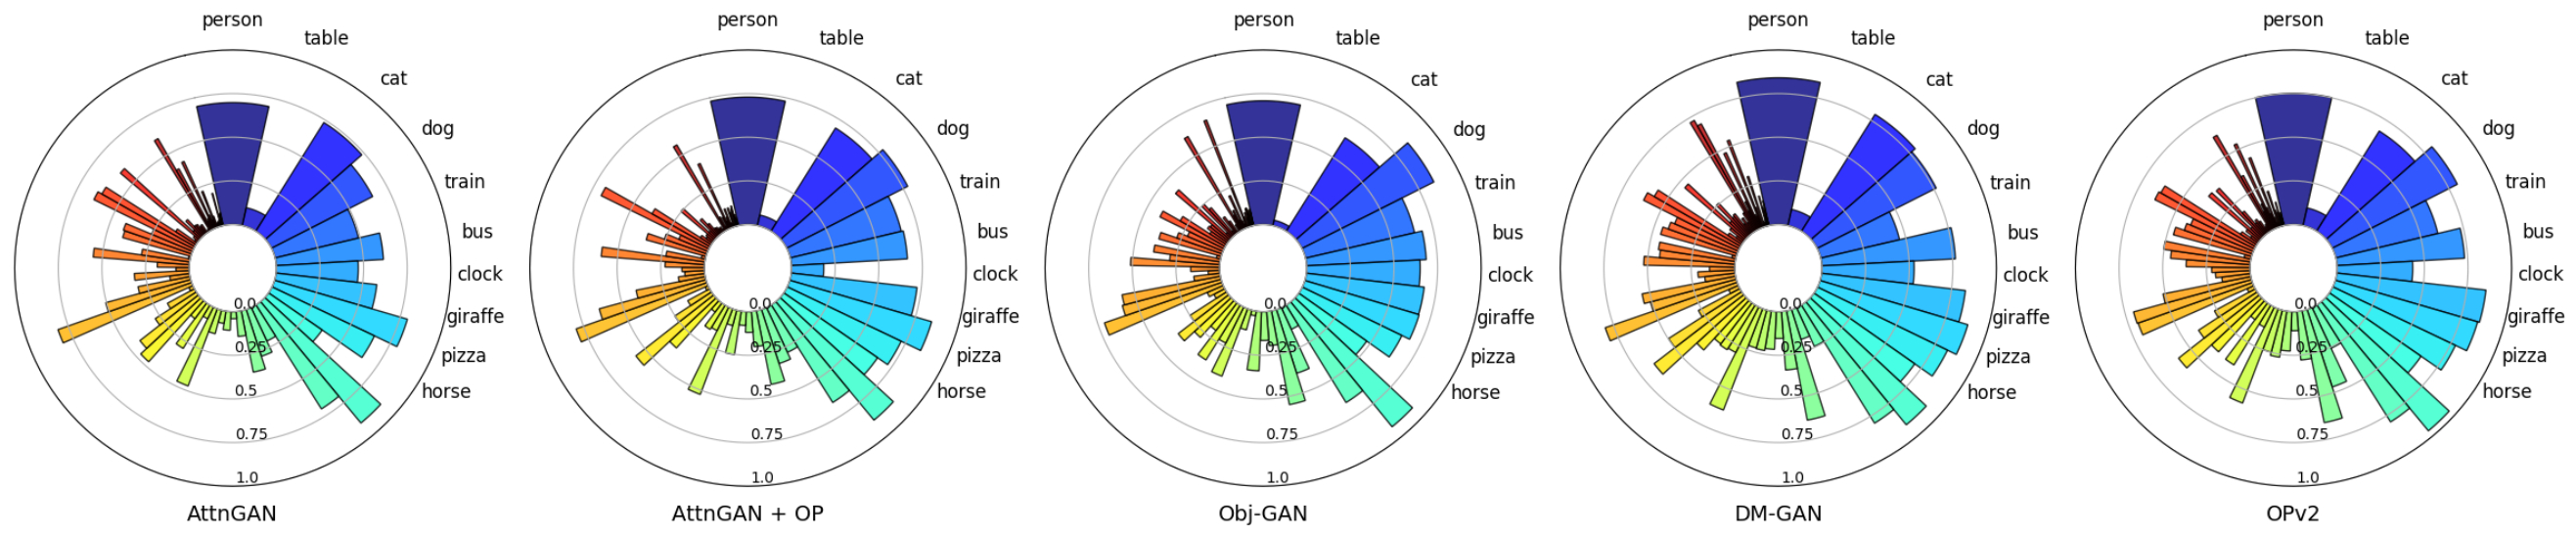
Overall, we find there are three characteristics that predict whether models are good at generating specific objects:
The first important characteristic is easily predictable: the higher the occurrence of an object in the training data, the better (on average) the final performance on this object.
Large objects, i.e. objects that usually cover a large part of the image (e.g. bus or elephant), are usually modeled better than objects that are usually small (spoon or baseball glove).
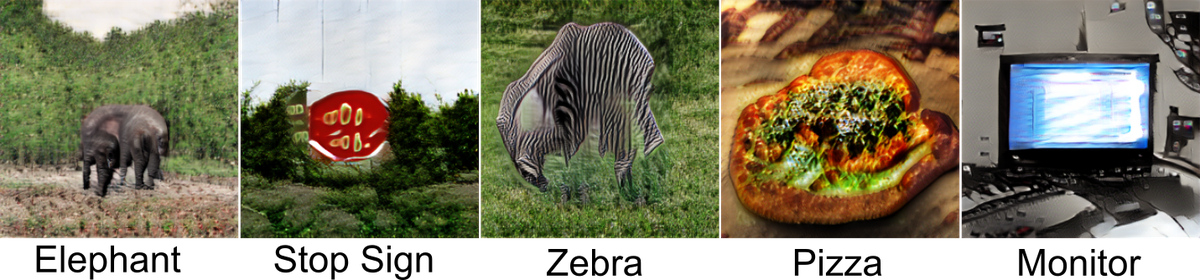
The final and more subtle characteristic is the surface texture of an object. Objects with highly distinct surface textures (e.g. zebra, giraffe, pizza, etc.) achieve high SOA scores because the object detection network relies on these textures to detect objects. However, while the models are able to correctly match the surface texture (e.g. black and white stripes for a zebra) they are still not capable of generating a realistic-looking shape of many objects. As a result, many of these objects possess the “correct” surface texture but their shape is more a general “blob”’ consisting of the texture and not a distinct form (e.g. a snout and for legs for a zebra).
Despite this short coming we still think the SOA can be an important metric for evaluating generative text-to-image models, since it gives us a much more detailed insight into the generation capabilities of a model. Furthermore, the only requirement is an object detector that works on the dataset we work on and pre-trained object detectors are readily available for many datasets that are used in research.
In order to further validate our results, we also performed a user study on Amazon Mechanical Turk. Similar to other approaches we sampled 5,000 random captions from the COCO validation set and showed people a given caption and the respective generated images. We then asked them to choose the image that depicts the given caption best. Our results show that the human ranking closely reflects the ranking obtained through the SOA and FID scores. However, we find that the IS score is not predictive of the performance in the user study. The R-precision and CIDEr are somewhat predictive, but predict a different ranking of the top-three performing models.
Please check out our paper for more detailed analyses of our model as well as the other models we compared our model with. The code to use the calculate the SOA scores on the MS-COCO dataset is available here.